Evaluating Sustainability Tradeoffs
3Summarize the Data
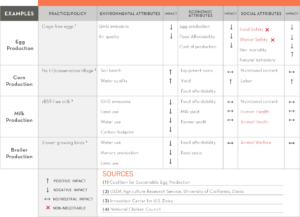
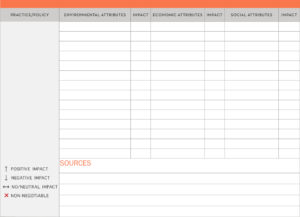
As you evaluate the implications of various practices, one method for summarizing the information is a simple chart with arrows or other symbols to represent the impacts of various attributes on sustainability dimension. We will use arrows – up, down and sideways – to indicate a positive, negative or neutral impact in that area. As shown in the examples that follow, you begin the process by creating a chart for the policy or practice under consideration that includes columns for each sustainability dimension (Environment, Economic, and Social) and then list the attributes or indicators which are a priority for your organization under each dimension. Using available information, determine whether the practice will have a positive, negative or neutral impact on each attribute area. The following chart includes high-level examples of this type of summary. We’ve provided a template to create charts for practices specific to your organization. You may choose to include more aspects under each dimension for a more comprehensive evaluation. Be careful to avoid “analysis paralysis,” that is, getting bogged down in quantifying every aspect or not making a decision because there isn’t sufficient data. Remember that this intended to be directional vs. definitive, and will reflect the values and priorities of your organization as well as available knowledge and technology at this point in time.Evaluating Tradeoffs Example
Evaluating Tradeoffs Template
 Download the Template Previous Step Next Step